Using Hexagonal Plotting & Dynamic Inventories
Using Hexagonal Plotting & Dynamic Inventories
Increasing ROAS by 84%

Share
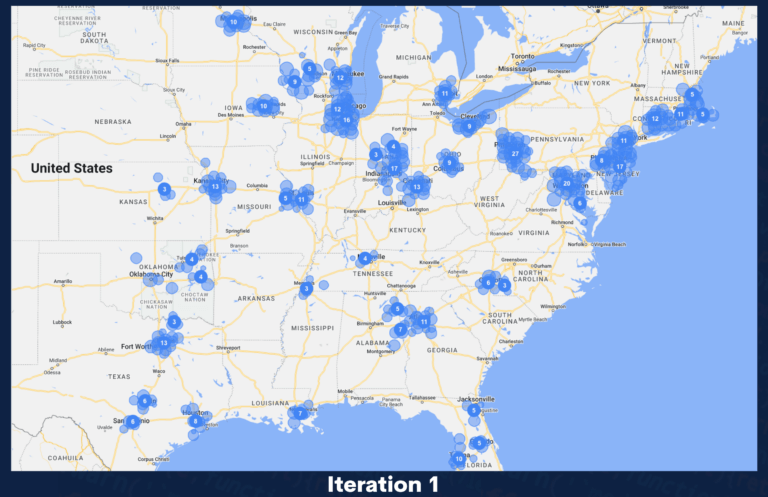
Imagine your site’s inventory is constantly changing, one day you have availability, the next you don’t, the day after that you have 10 available, the next 4.
Now, let’s add some more complexity. Not only is your inventory volume changing constantly, the geographical location of your inventory is evermoving and you need to be precise with your marketing targeting or you won’t receive any revenue.
Welcome to the world of DirectlyApply, a London-based technology company focused on job discovery across the US.
They operate a 2-way marketplace which enables job seekers to match with thousands of local jobs advertised by hundreds of employers.
At a first glance, DirectlyApply’s revenue model is simple; they earn a fee with each successful job application that originates from their platform. There are dozens of parameters that define a successful application, but one of the most crucial is the seekers location in relation to the job.
In most cases, DirectlyApply will not generate a commission if the user is located further than a set distance from the position they applied for.
Job inventory and locations are constantly updating (often, multiple times a day), and so is the fee the employers pay. Not adapting quickly within this constantly shifting landscape from a supply point of view results in wasted spend in areas that will bring no revenue.
WeDiscover & DirectlyApply partnered in mid-2022 with the aim of tackling these challenges, focusing from the offset on developing a technology-led Paid Search strategy to act as a backbone for growth.
Designing a suitable Account Structure
The scale of DirectlyApply is vast – across the entirety of the US working daily with tens of thousands of employers, thousands of job seekers and millions of ever-changing jobs.
When you combine the hyper-local nature of the business and its perpetual dynamism with the strict need for extremely accurate geo-targeting… Well, some interesting challenges emerge for managing Paid Search campaigns.
Our first port of call was creating a scalable and tailored structure. It had to be future-proof for automation and testing, but also tailored and consistent to guarantee relevance.
We devised three core elements that we thought were fundamental to designing the account structure: location, job type and employer.
Each of those 3 elements were important to control for the following reasons:
-
- Location targeting, if an application came in for a job posting from a user who was in a non-targeted location, it would be a non-revenue event.
- Job Type, for keyword structures as well as commercial reasons. I.e. different job types received different revenue figures and commissions.
- Each employer had different job volume requirements, so a different feed needed to be created for each in order to activate or deactivate activity.
The end result was an account structure which gave us control over budgets for each employer, and efficiency targets, but also allowed for accurate geo-targeting at the campaign level.
However, creating a system for how we a) defined our geo-targeting and b) inserted this into Google Ads was going to be the next challenge…
Creating a solution for geo-location targeting
Once we had the account structure in place we then had 2 subsequent projects we needed to implement, creating our geo-targeting methodology and inventory management (i.e. location automation).
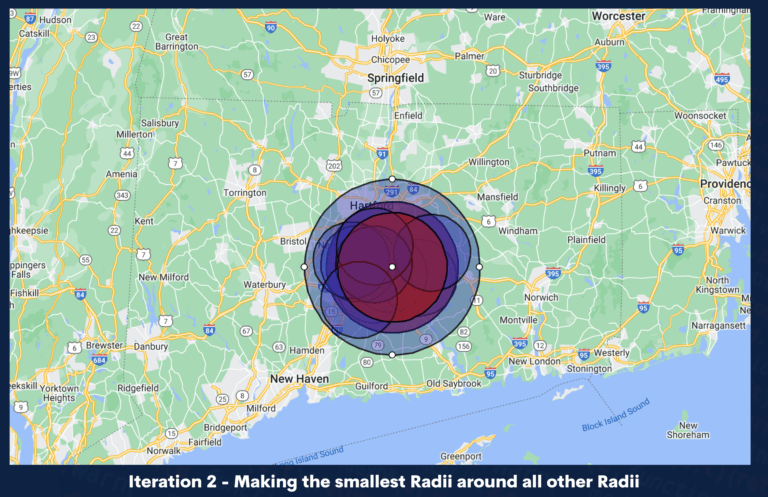
The largest and most complex project was going to be geo-targeting methodology.
Here were some other considerations when thinking about how to tackle this challenge:
- Hyper-local nature of the business: would you apply for physical jobs (i.e. ones where you have to be there) far away from where you live? Probably not. In order to do this on site, the DirectlyApply team worked on an automated system that only shows relevant jobs around the user location, whilst dynamically tailoring the landing page content based on the parameters being passed through paid search campaigns. This means that the landing page user experience would be in a good position as we added more traffic.
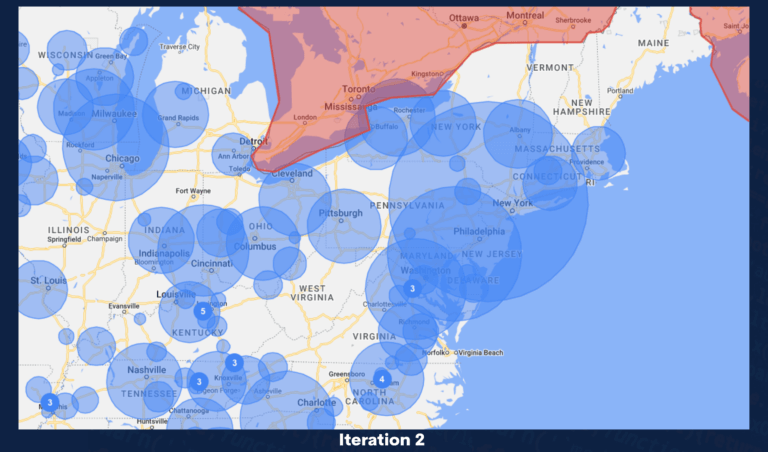
- Dynamic market landscape: job openings are constantly changing based on the employer’s needs. The volume of vacancies in a certain area is completely dynamic and it can vary on hours, days, weeks… depending on the job and the employer.
- Rapid expansion: every solution we created needed to be applicable to the current employer partnerships, but also to any new ones coming in the future. We had to create a global system that could bring consistency across all campaigns but also provide enough flexibility to each partnership’s needs.
Geo-location automation
Once we were happy with the geo-location targeting methodology we wanted to build a system to ensure that the location targets were refreshed as often as they needed to be in Google Ads.
While we were running the tests these updates were still being done manually (via bulk uploads), but this turned into quite a large time sink. Moving onto building an automated tool was the next best step.
DirectlyApply ingests information from suppliers (employers), then cleans and normalise the data, creates an export in the appropriate format then the Google Ads Tool takes the data and does 3 things:
-
- Checks for new locations that we should be targeting but are not currently.
- Checks for locations that we are already targeting.
- Checks for locations that we should not be targeting but currently are.
Then makes the appropriate changes in Google Ads (here is the Geo-Location Automation Schematic):
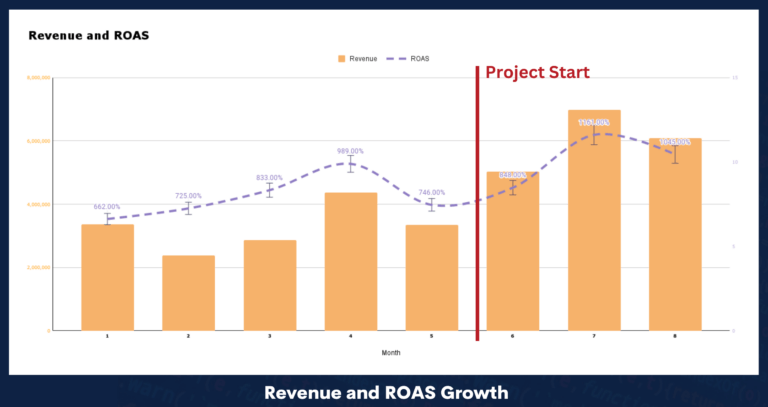
Results
DirectlyApply & WeDiscover worked extremely closely across all aspects of this project, using each other’s technology resources interchangeably. It’s been a brilliant example of what is possible when complex Performance Marketing challenges are tackled on an iterative solution process.
Since the implementation of the initial geo-location solution we’ve seen the following results:
- Revenue +84.92%
- ROAS +28.69%
We look forward to many more innovative solutions with the DirectlyApply team.